> ## Documentation Index
> Fetch the complete documentation index at: https://docs.prompteus.com/llms.txt
> Use this file to discover all available pages before exploring further.
# Dashboard
> Monitor your Neurons' performance, usage, and cost savings through the Prompteus dashboard.
The Prompteus dashboard provides real-time insights into your Neurons' performance, usage metrics, and cost savings. This guide explains how to interpret the dashboard metrics and use them to optimize your Neurons.
## Dashboard Overview
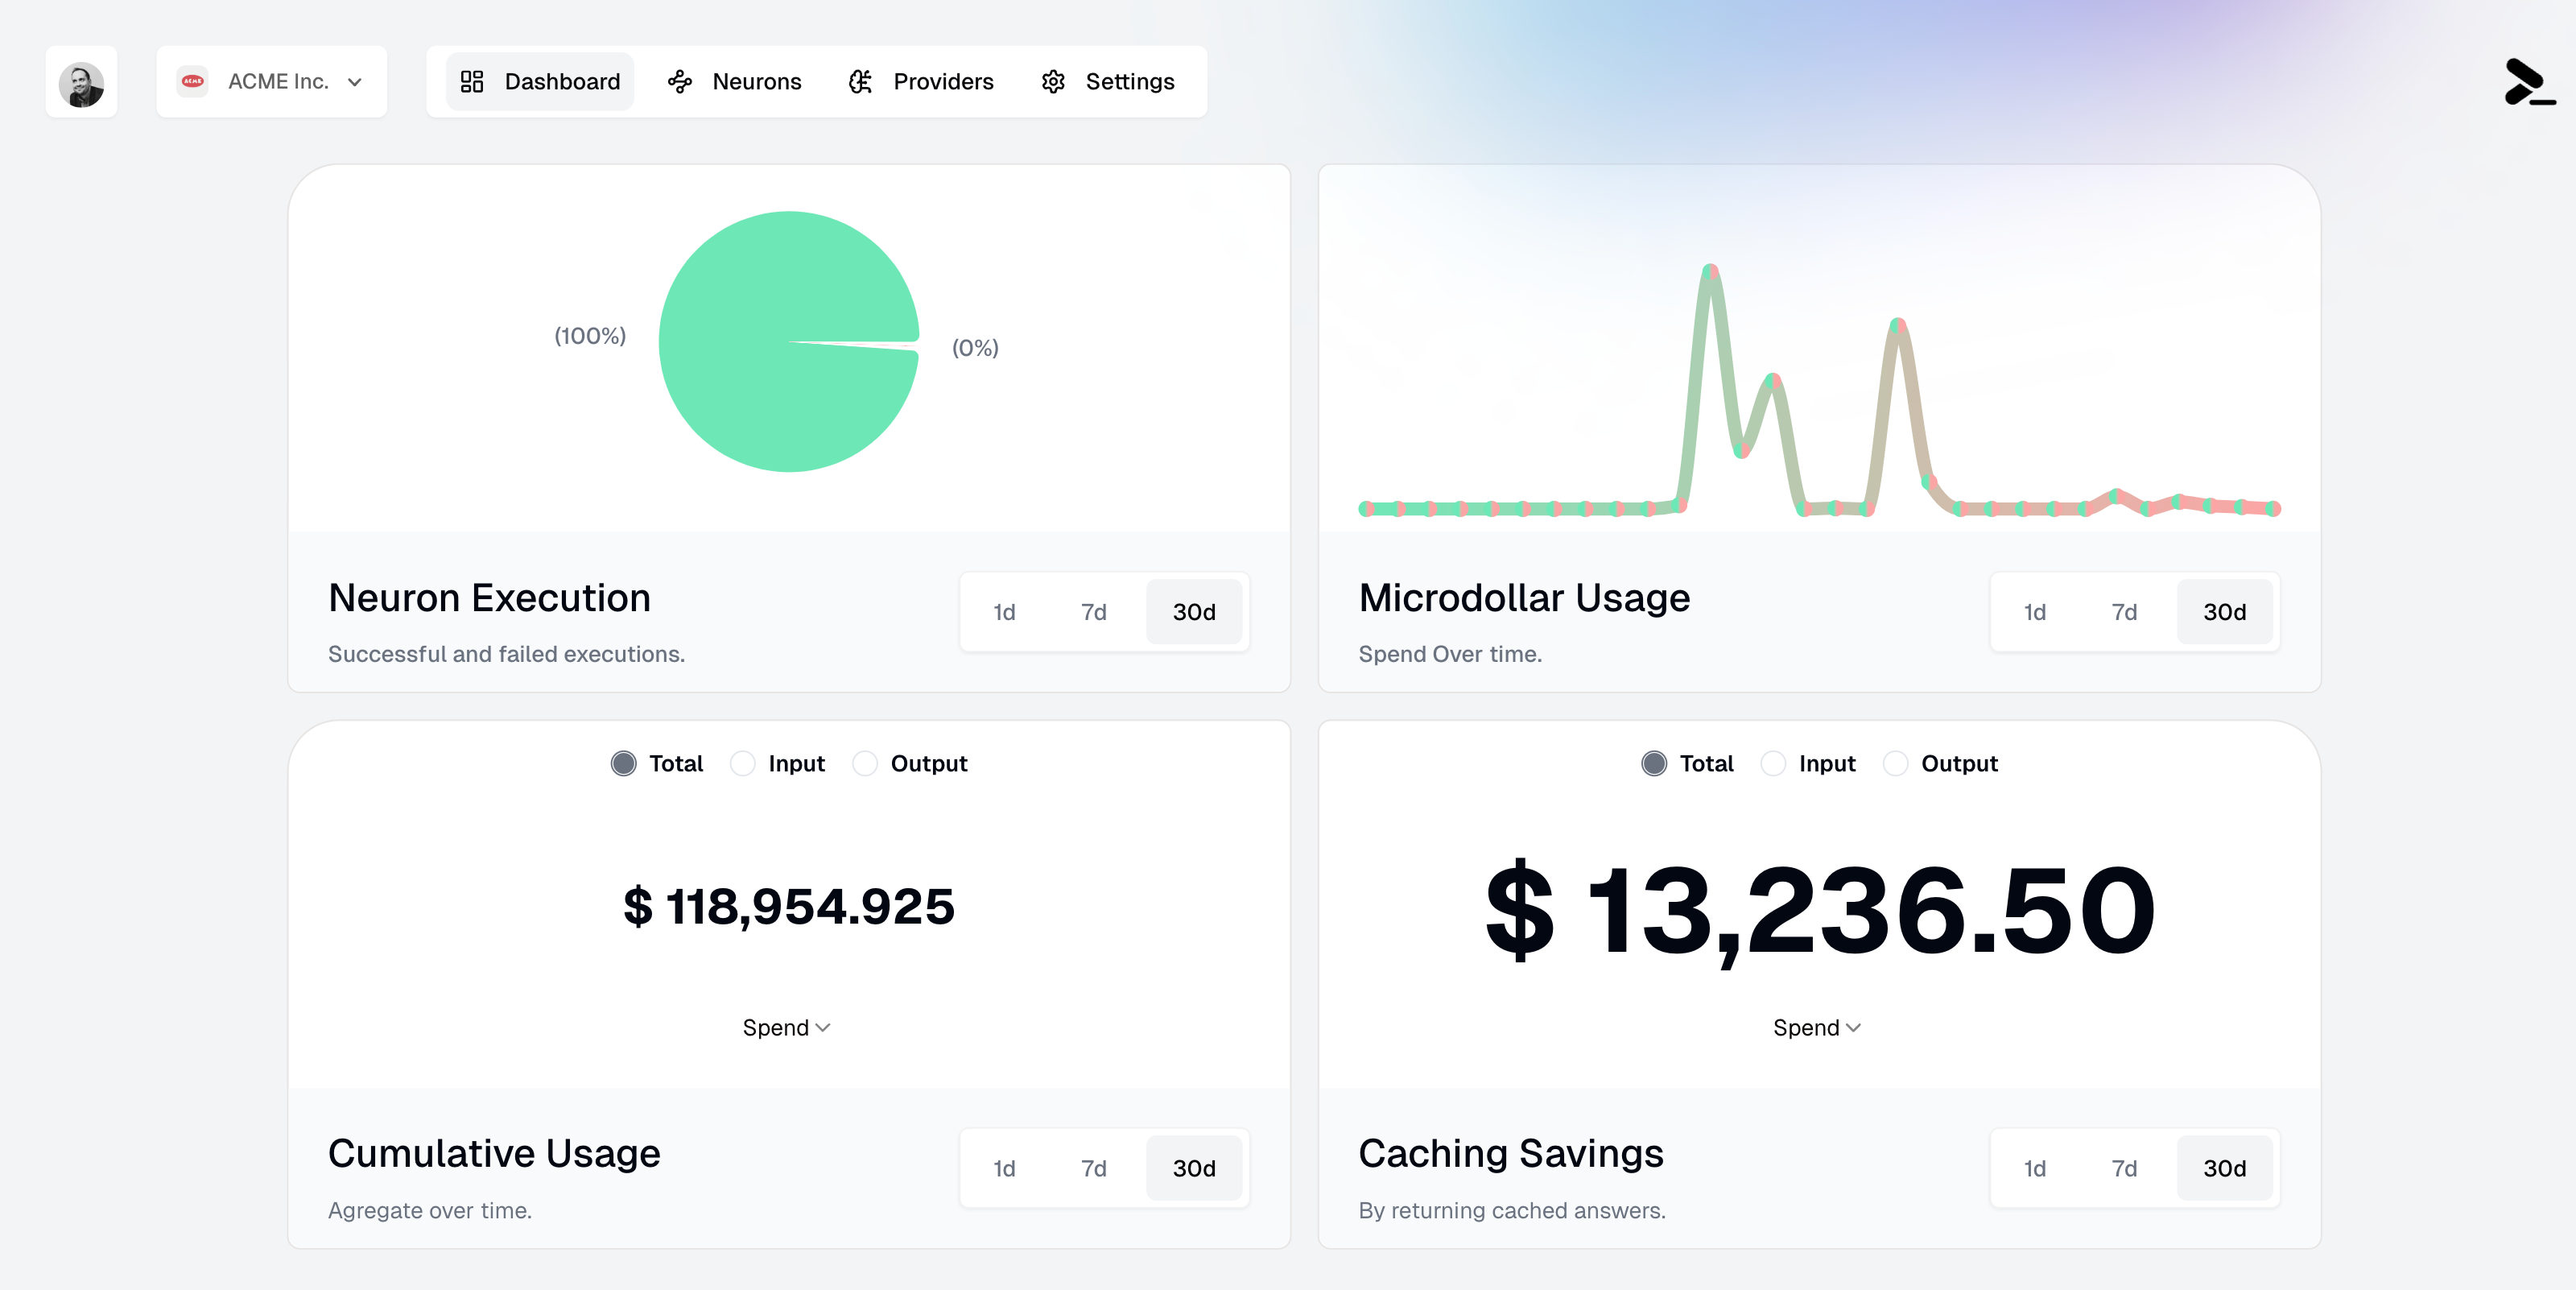 The dashboard consists of four main panels that give you a comprehensive view of your Neurons' performance and costs:
### Neuron Execution
The Neuron Execution panel shows the success rate of your Neuron executions through a pie chart visualization. It displays:
* Successful executions (green)
* Failed executions (if any, in red)
* Time range filters: 1d, 7d, and 30d
This metric helps you monitor the reliability of your Neurons and quickly identify if there are any issues that need attention.
### Microdollar Usage
The Microdollar Usage panel shows your spending over time. A microdollar (μ\$) is one millionth of a dollar, allowing for precise tracking of API costs at a very granular level. The graph shows:
* Usage patterns over time
* Spending spikes and trends
* Time range filters: 1d, 7d, and 30d
Microdollars (μ\$) are used to track costs with high precision. For example:
* μ\$1,000,000 = \$1.00
* μ\$100,000 = \$0.10
* μ\$1,000 = \$0.001
### Cumulative Usage
The Cumulative Usage panel tracks your total resource consumption, with options to view:
* Total tokens processed
* Input tokens
* Output tokens
* Total spend
* Time range filters: 1d, 7d, and 30d
For better readability, the dashboard automatically switches between dollars (\$) and microdollars (μ\$) based on the amount:
* Large amounts (≥ \$1.00) are shown in dollars (e.g., \$118,954.925)
* Small amounts (\< \$1.00) are shown in microdollars (e.g., μ\$100,000)
This helps you understand your overall usage patterns and plan capacity accordingly.
### Caching Savings
The Caching Savings panel shows how much you've saved through [caching](/neurons/settings/caching). It displays:
* Total amount saved through cache hits
* Savings over time graph
* Time range filters: 1d, 7d, and 30d
Like the Cumulative Usage panel, this panel also automatically switches between dollars and microdollars for better readability:
* Significant savings are displayed in dollars (e.g., \$13,236.50)
* Smaller savings are displayed in microdollars (e.g., μ\$13,236)
The automatic unit switching between dollars (\$) and microdollars (μ\$) helps you quickly understand the scale of usage and savings:
* Microdollars (μ\$) provide precision for small amounts
* Dollars (\$) offer familiarity for larger amounts
* The switch happens automatically at the \$0.0001 threshold
## Using Dashboard Insights
Here are some ways to use dashboard insights effectively:
1. **Monitor Performance**
* Track success rates to ensure your Neurons are functioning properly
* Identify patterns in failed executions through [detailed execution logs](/neurons/logging)
* [Configure rate limiting](/neurons/settings/rate-limiting) based on usage patterns
2. **Optimize Costs**
* Monitor microdollar usage to identify expensive operations
* Track caching savings to validate your [caching strategy](/neurons/settings/caching)
* Adjust [access controls](/neurons/settings/access-control) if you notice unexpected usage patterns
3. **Capacity Planning**
* Use cumulative usage data to forecast future needs
* Identify peak usage periods
* Plan for scaling based on growth trends
The dashboard consists of four main panels that give you a comprehensive view of your Neurons' performance and costs:
### Neuron Execution
The Neuron Execution panel shows the success rate of your Neuron executions through a pie chart visualization. It displays:
* Successful executions (green)
* Failed executions (if any, in red)
* Time range filters: 1d, 7d, and 30d
This metric helps you monitor the reliability of your Neurons and quickly identify if there are any issues that need attention.
### Microdollar Usage
The Microdollar Usage panel shows your spending over time. A microdollar (μ\$) is one millionth of a dollar, allowing for precise tracking of API costs at a very granular level. The graph shows:
* Usage patterns over time
* Spending spikes and trends
* Time range filters: 1d, 7d, and 30d
Microdollars (μ\$) are used to track costs with high precision. For example:
* μ\$1,000,000 = \$1.00
* μ\$100,000 = \$0.10
* μ\$1,000 = \$0.001
### Cumulative Usage
The Cumulative Usage panel tracks your total resource consumption, with options to view:
* Total tokens processed
* Input tokens
* Output tokens
* Total spend
* Time range filters: 1d, 7d, and 30d
For better readability, the dashboard automatically switches between dollars (\$) and microdollars (μ\$) based on the amount:
* Large amounts (≥ \$1.00) are shown in dollars (e.g., \$118,954.925)
* Small amounts (\< \$1.00) are shown in microdollars (e.g., μ\$100,000)
This helps you understand your overall usage patterns and plan capacity accordingly.
### Caching Savings
The Caching Savings panel shows how much you've saved through [caching](/neurons/settings/caching). It displays:
* Total amount saved through cache hits
* Savings over time graph
* Time range filters: 1d, 7d, and 30d
Like the Cumulative Usage panel, this panel also automatically switches between dollars and microdollars for better readability:
* Significant savings are displayed in dollars (e.g., \$13,236.50)
* Smaller savings are displayed in microdollars (e.g., μ\$13,236)
The automatic unit switching between dollars (\$) and microdollars (μ\$) helps you quickly understand the scale of usage and savings:
* Microdollars (μ\$) provide precision for small amounts
* Dollars (\$) offer familiarity for larger amounts
* The switch happens automatically at the \$0.0001 threshold
## Using Dashboard Insights
Here are some ways to use dashboard insights effectively:
1. **Monitor Performance**
* Track success rates to ensure your Neurons are functioning properly
* Identify patterns in failed executions through [detailed execution logs](/neurons/logging)
* [Configure rate limiting](/neurons/settings/rate-limiting) based on usage patterns
2. **Optimize Costs**
* Monitor microdollar usage to identify expensive operations
* Track caching savings to validate your [caching strategy](/neurons/settings/caching)
* Adjust [access controls](/neurons/settings/access-control) if you notice unexpected usage patterns
3. **Capacity Planning**
* Use cumulative usage data to forecast future needs
* Identify peak usage periods
* Plan for scaling based on growth trends