> ## Documentation Index
> Fetch the complete documentation index at: https://docs.prompteus.com/llms.txt
> Use this file to discover all available pages before exploring further.
# Execution Logs
> Monitor and debug your neuron executions with detailed logs
# Execution Logs
 Each neuron execution is logged with detailed information about the execution flow, inputs, outputs, and decision points. These logs are essential for monitoring your neuron's performance and debugging any issues that may arise.
## Accessing Logs
Logs are accessible directly from the neuron editor by clicking on the "Logs" tab. Each execution is identified by:
* Timestamp of execution
* Unique execution ID
* Source IP address
* Execution status (success/stopped)
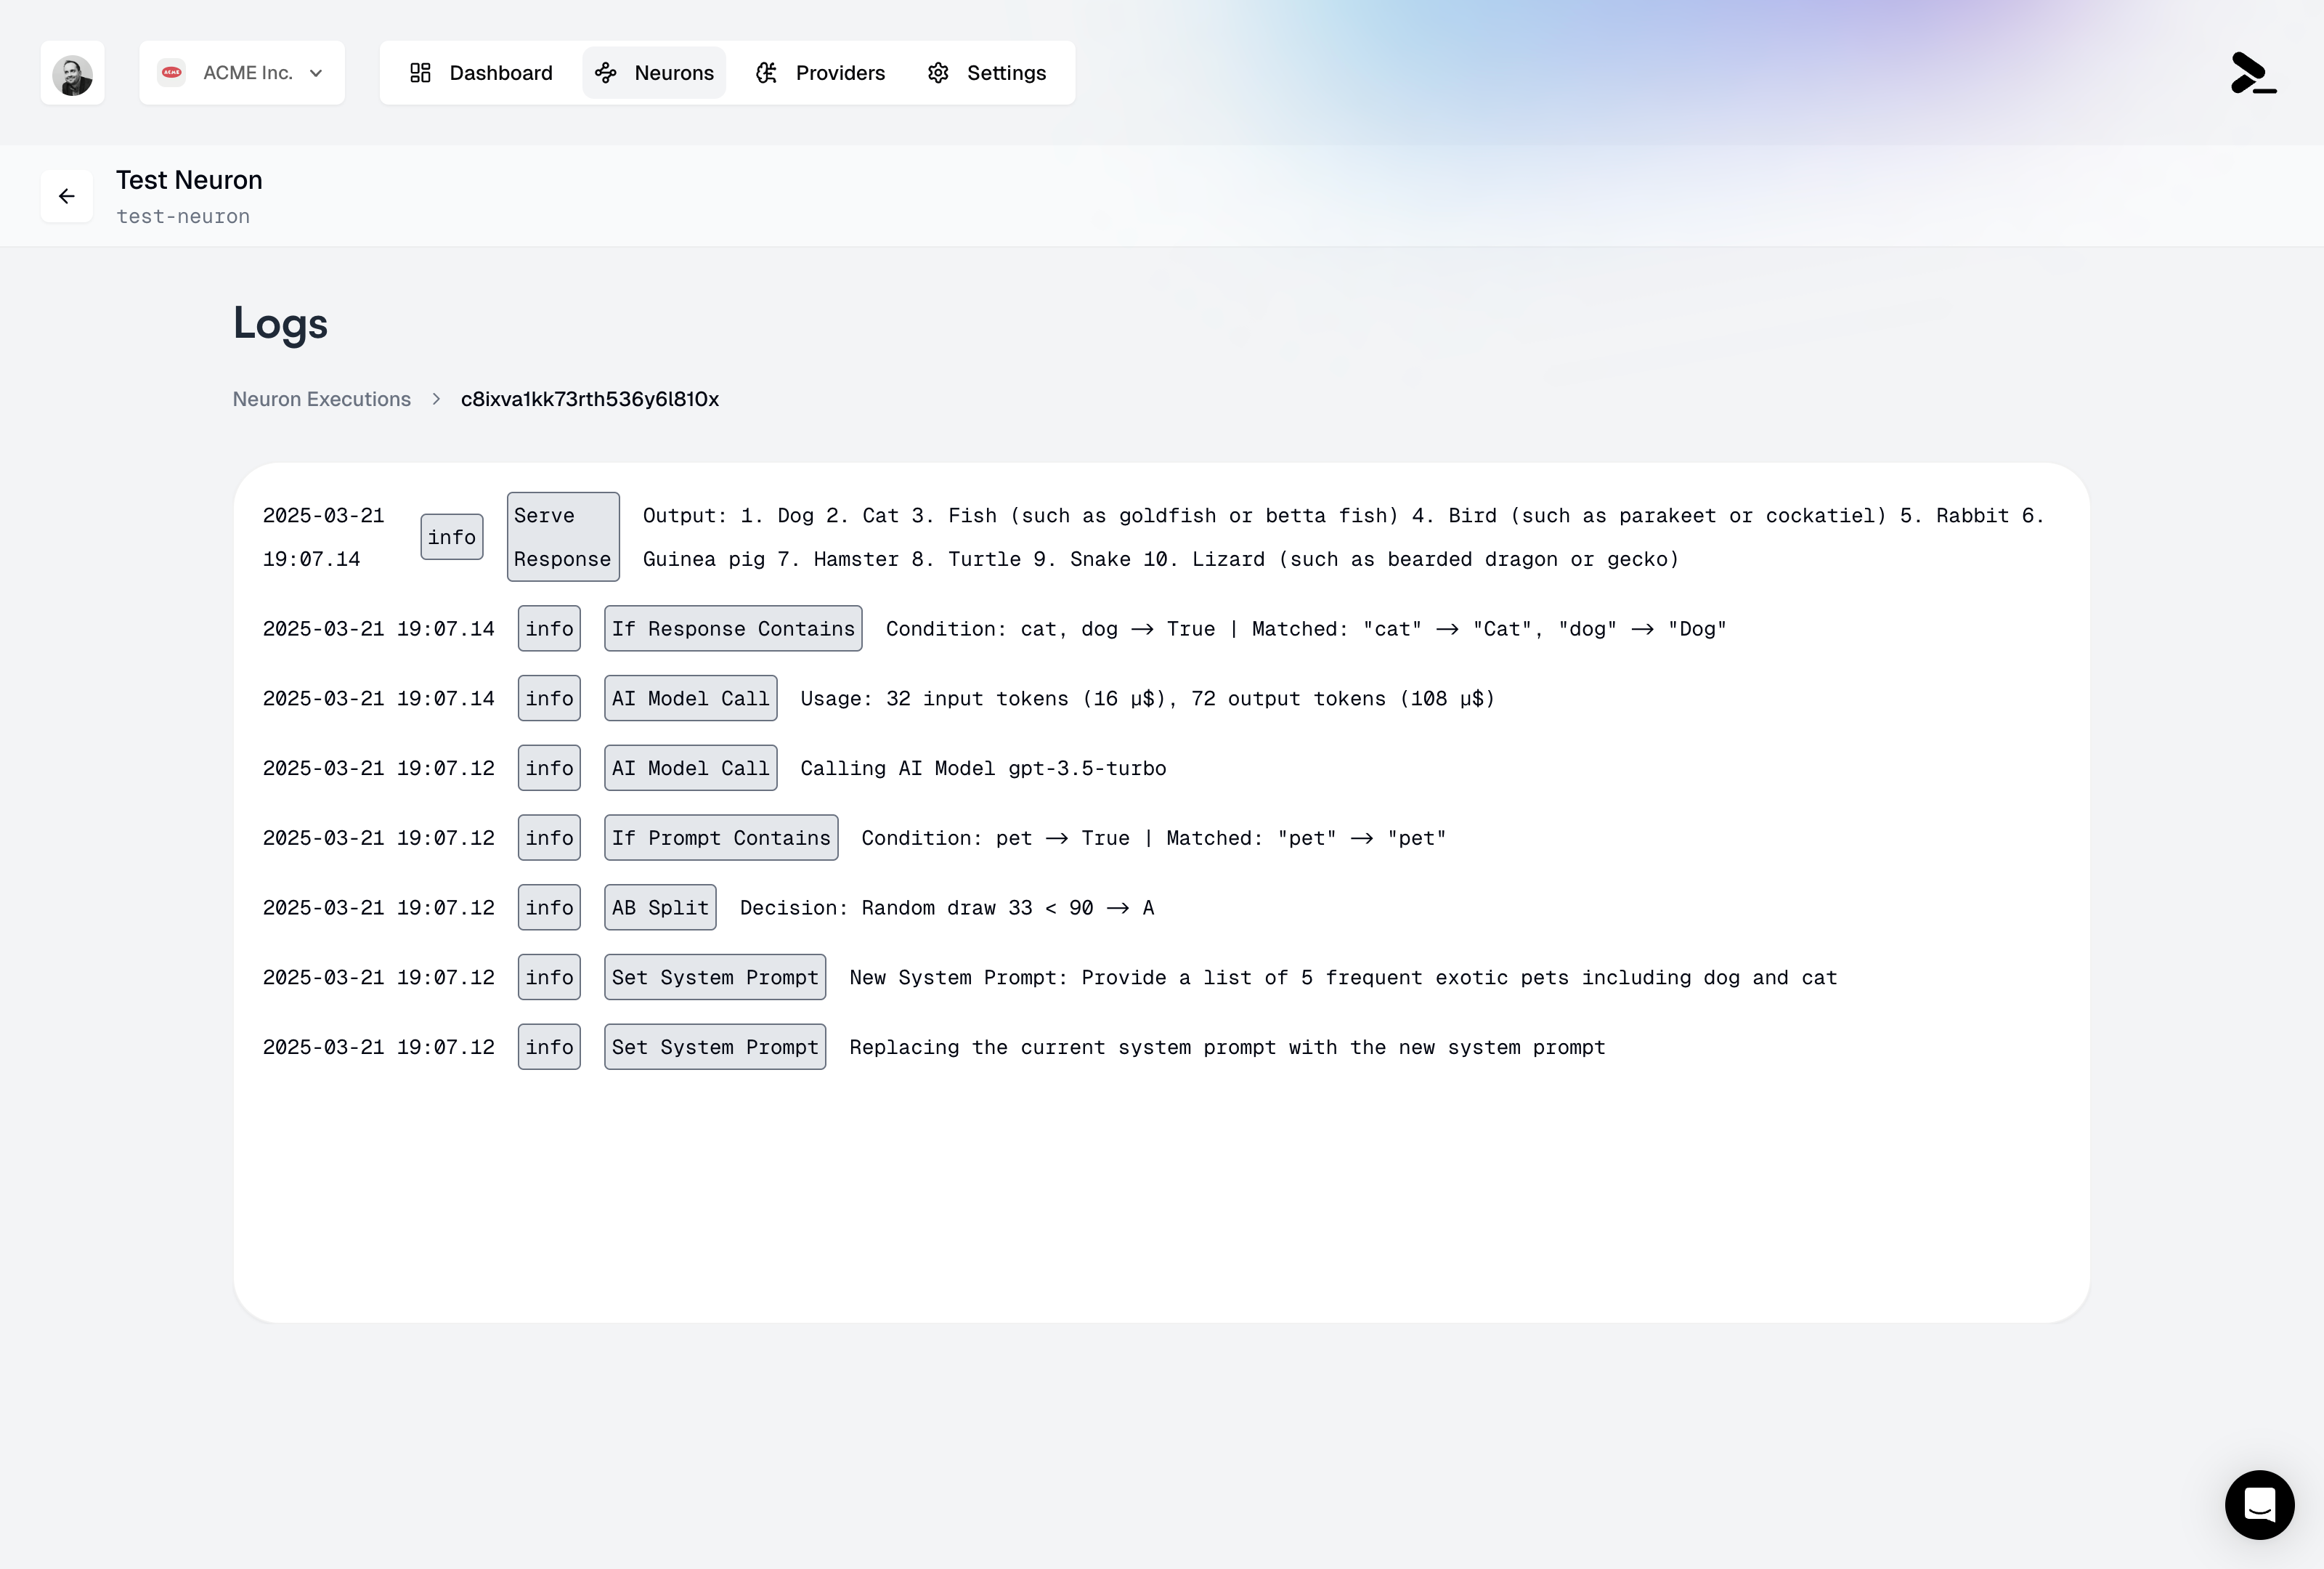
## Log Details
The execution logs provide a complete trace of every node executed in your neuron, presented in chronological order. Each log entry includes:
* **Node Type**: The specific type of node executed
* **Timestamp**: When the node execution occurred
* **Input Data**: The data received by the node
* **Output/Decision**: The result or output of the node execution
Common node execution examples include:
* **System Instructions**: Changes or updates to the system instructions
* **AI Model Calls**: Complete details including:
* Input/output token counts and costs
* Model version used (e.g., gpt-3.5-turbo)
* Total request cost in USD
* **Condition Nodes**: Results of [If Output Contains](/neurons/editor/nodes/if-output-contains) and [If Input Contains](/neurons/editor/nodes/if-input-contains) checks, including the matched patterns
* **AB Testing**: [Randomized Split](/neurons/editor/nodes/randomized-split) decisions and their outcomes
* **Serve Output**: Final outputs returned to the client
## Cost Tracking
Each execution log includes detailed cost information:
* Per-request cost breakdown
* Token usage per AI model call
* Cumulative cost for the entire execution
* Cost allocation by model type
This granular cost tracking helps you:
* Optimize expensive execution paths
* Monitor usage patterns
* Set up cost alerts
* Generate detailed billing reports
## Log Retention
You can choose different log retention plans, from 1 day to 365 days, directly in your [billing settings](/features/settings/billing).
For longer retention needs, please [contact our support team](mailto:support@prompteus.com).
## Related Features
* [Rate Limiting](/neurons/settings/rate-limiting) - Configure execution limits and monitor usage
* [Caching](/neurons/settings/caching) - Optimize performance and costs
* [Version Management](/neurons/editor/version-management) - Track changes to your neuron configuration
* [Access Control](/neurons/settings/access-control) - Manage who can view execution logs
## Best Practices
1. **Regular Monitoring**: Check your logs periodically to ensure your neuron is performing as expected
2. **Debug Mode**: During development, use the detailed logs to understand the execution flow
3. **Cost Optimization**: Monitor token usage through logs to optimize your prompts and responses
4. **Security**: Review IP addresses and execution patterns to detect unusual activity
## Export and Integration
For additional support or custom log retention requirements, please [contact our support team](mailto:support@prompteus.com).
Each neuron execution is logged with detailed information about the execution flow, inputs, outputs, and decision points. These logs are essential for monitoring your neuron's performance and debugging any issues that may arise.
## Accessing Logs
Logs are accessible directly from the neuron editor by clicking on the "Logs" tab. Each execution is identified by:
* Timestamp of execution
* Unique execution ID
* Source IP address
* Execution status (success/stopped)
## Log Details
The execution logs provide a complete trace of every node executed in your neuron, presented in chronological order. Each log entry includes:
* **Node Type**: The specific type of node executed
* **Timestamp**: When the node execution occurred
* **Input Data**: The data received by the node
* **Output/Decision**: The result or output of the node execution
Common node execution examples include:
* **System Instructions**: Changes or updates to the system instructions
* **AI Model Calls**: Complete details including:
* Input/output token counts and costs
* Model version used (e.g., gpt-3.5-turbo)
* Total request cost in USD
* **Condition Nodes**: Results of [If Output Contains](/neurons/editor/nodes/if-output-contains) and [If Input Contains](/neurons/editor/nodes/if-input-contains) checks, including the matched patterns
* **AB Testing**: [Randomized Split](/neurons/editor/nodes/randomized-split) decisions and their outcomes
* **Serve Output**: Final outputs returned to the client
## Cost Tracking
Each execution log includes detailed cost information:
* Per-request cost breakdown
* Token usage per AI model call
* Cumulative cost for the entire execution
* Cost allocation by model type
This granular cost tracking helps you:
* Optimize expensive execution paths
* Monitor usage patterns
* Set up cost alerts
* Generate detailed billing reports
## Log Retention
You can choose different log retention plans, from 1 day to 365 days, directly in your [billing settings](/features/settings/billing).
For longer retention needs, please [contact our support team](mailto:support@prompteus.com).
## Related Features
* [Rate Limiting](/neurons/settings/rate-limiting) - Configure execution limits and monitor usage
* [Caching](/neurons/settings/caching) - Optimize performance and costs
* [Version Management](/neurons/editor/version-management) - Track changes to your neuron configuration
* [Access Control](/neurons/settings/access-control) - Manage who can view execution logs
## Best Practices
1. **Regular Monitoring**: Check your logs periodically to ensure your neuron is performing as expected
2. **Debug Mode**: During development, use the detailed logs to understand the execution flow
3. **Cost Optimization**: Monitor token usage through logs to optimize your prompts and responses
4. **Security**: Review IP addresses and execution patterns to detect unusual activity
## Export and Integration
For additional support or custom log retention requirements, please [contact our support team](mailto:support@prompteus.com).