Execution Logs
Accessing Logs
Logs are accessible directly from the neuron editor by clicking on the “Logs” tab. Each execution is identified by:- Timestamp of execution
- Unique execution ID
- Source IP address
- Execution status (success/stopped)
Log Details
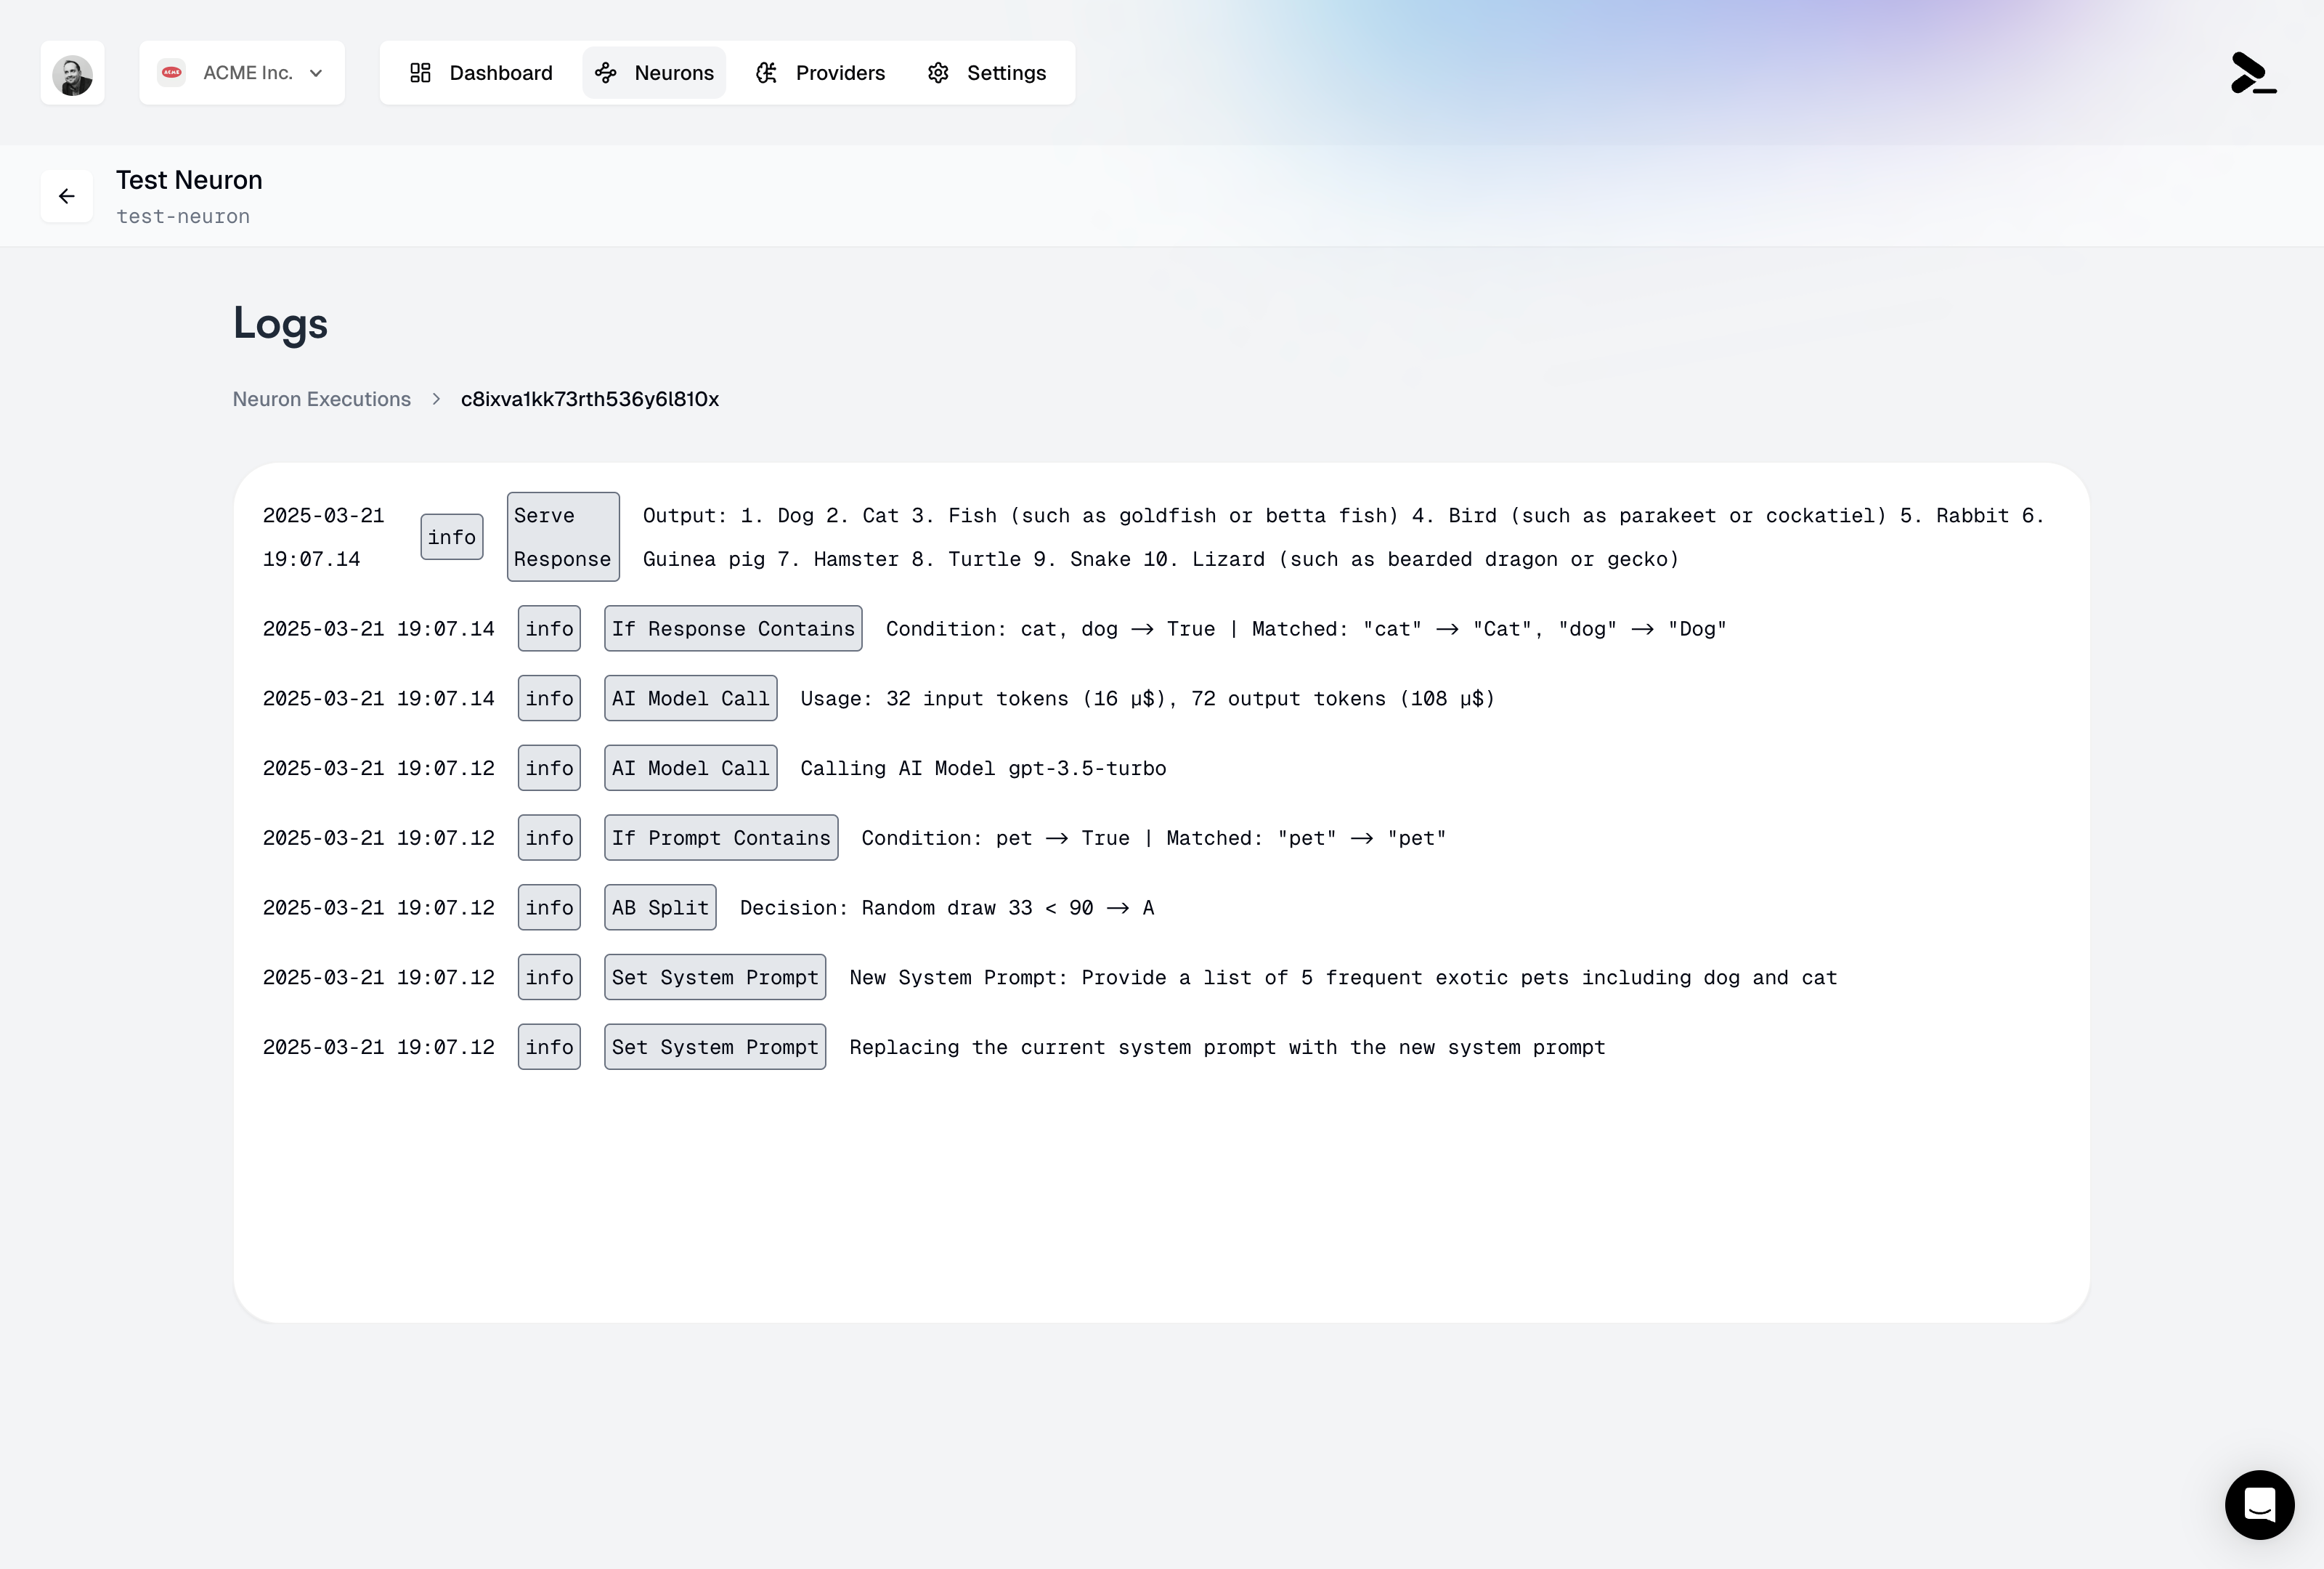
The execution logs provide a complete trace of every node executed in your neuron, presented in chronological order. Each log entry includes:- Node Type: The specific type of node executed
- Timestamp: When the node execution occurred
- Input Data: The data received by the node
- Output/Decision: The result or output of the node execution
- System Instructions: Changes or updates to the system instructions
- AI Model Calls: Complete details including:
- Input/output token counts and costs
- Model version used (e.g., gpt-3.5-turbo)
- Total request cost in USD
- Condition Nodes: Results of If Output Contains and If Input Contains checks, including the matched patterns
- AB Testing: Randomized Split decisions and their outcomes
- Serve Output: Final outputs returned to the client
Cost Tracking
Each execution log includes detailed cost information:- Per-request cost breakdown
- Token usage per AI model call
- Cumulative cost for the entire execution
- Cost allocation by model type
- Optimize expensive execution paths
- Monitor usage patterns
- Set up cost alerts
- Generate detailed billing reports
Log Retention
You can choose different log retention plans, from 1 day to 365 days, directly in your billing settings. For longer retention needs, please contact our support team.Related Features
- Rate Limiting - Configure execution limits and monitor usage
- Caching - Optimize performance and costs
- Version Management - Track changes to your neuron configuration
- Access Control - Manage who can view execution logs
Best Practices
- Regular Monitoring: Check your logs periodically to ensure your neuron is performing as expected
- Debug Mode: During development, use the detailed logs to understand the execution flow
- Cost Optimization: Monitor token usage through logs to optimize your prompts and responses
- Security: Review IP addresses and execution patterns to detect unusual activity